Linear and nonlinear scales
One of the most common traits found on gauges are their characteristic scales, with tickmarks and matching numeric values.
In most design apps these scales have to be created by entering each tickmark value one by one. Even with convenient radial copy tools, this can still take some time, especially when trying different options.
GaugeMaster Pro takes advantage of some key patterns that characterize gauges and provides parametric tools to quickly generate tickmarks and value sequences with very little effort. These type of tools are mostly for linear gauge scales.
For more complex designs where tickmarks or values may not have a linear correlation between them, the app has a powerful nonlinear option. With this option you can import a CSV spreadsheet file to easily generate tickmarks and values at precise arbitrary locations across an arc.
Linear
Section titled “Linear”Linear scales are usually made up of a segment that gets repeated for a number of major steps/divisions on the arc. For example, a pressure gauge from 0 to 100 bar may have a linear segment with one major tickmark and nine minor tickmarks, repeated every 10 bar.
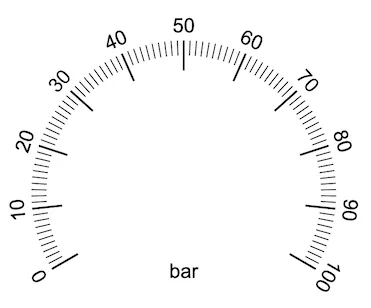
Within every segment we can specify any combination of tickmarks by adding subsegments that define the following parameters for the tickmarks they represent:
- count: how many tickmarks to draw for the subsegment
- length: the tickmarks length within the width of the arc, from 0 to 1, 1 being the full arc width
- shape: the tick shape of the tickmarks on this subsegment, lines, dots, triangles or diamonds
- width: the thickness of line tickmarks on this subsegment, or the width ratio of triangles and diamonds
On the previous 1 to 100 bar example, we would have two subsegments, the one defining the major tickmark, and the one defining the 9 minor tickmarks as follows:
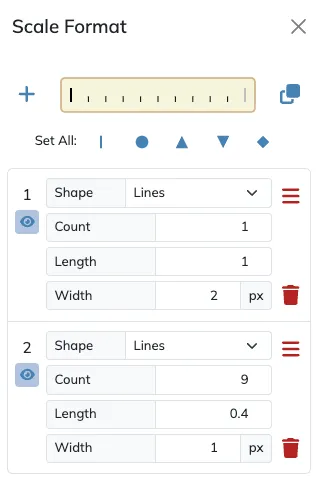
When editing any of the subsegments, its tickmarks will show in red on the segment preview at the top of the subsegment list, and on the gauge on the canvas. As you modify the subsegment values you will see them updating in real-time so you can quickly define your needed tickmarks pattern. A hidden subsegment shows in light grey on the preview, and in a lighter red on the canvas while it is selected.
Nonlinear
Section titled “Nonlinear”Nonlinear scales allow full freedom to design your scales. They are built from CSV files you generate on your favorite spreadsheet app. The CSV file will contain the location of the nonlinear element (tick mark or text), and any other key details required to render it, as specified below.
The format of each line on this CSV file is as follows:
Tickmarks Arc
- location: location within the arc, being 0 the start angle and 1 the end angle.
- length: length of the tickmark within the width of the arc, being 1 the full width of the arc.
- width: the thickness of the tickmark.
Text Arc
- location: location within the arc, being 0 the start angle and 1 the end angle.
- text: the text for each location.
Here are some sample nonlinear tickmarks arc spreadsheet values:
| location | length | width |
|---|---|---|
| 0 | 1 | 3 |
| 0.053 | 0.5 | 2 |
| 0.158 | 1 | 3 |
| 0.394 | 1 | 3 |
| 0.655 | 1 | 3 |
| 0.827 | 0.5 | 2 |
| 1 | 1 | 3 |
And here is the resulting nonlinear tickmarks arc CSV file content:
location,length,width0,1,30.053,0.5,20.158,1,30.394,1,30.655,1,30.827,0.5,21,1,1Here are some sample nonlinear text arc spreadsheet values:
| location | text |
|---|---|
| 0 | 0 |
| 0.16 | 2 |
| 0.39 | 5 |
| 0.66 | 8 |
| 1 | 10 |
And here is the resulting nonlinear text arc CSV file content:
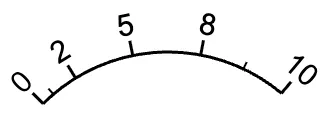
location,text0,00.16,20.39,50.66,81,10And here is the resulting gauge with the tickmarks and text arcs:
Importing/Exporting CSV files
Section titled “Importing/Exporting CSV files”
Use the Import nonlinear CSV file button to load the CSV file for your nonlinear arc.
You can also use the Export nonlinear CSV button to export the CSV file of any existing nonlinear arc. This could be useful to restore the CSV file of an old gauge design or to tweak some of the values of nonlinear arc.
Editing individual items
Section titled “Editing individual items”Since nonlinear arcs are created with individual elements at precise locations determined by you, you edit these details individually with the nonlinear editor.
 Use the Scale Format editor button, the tickmarks preview button, to access the nonlinear tickmarks arc editor list.
 Use the
 Edit Nonlinear Text button to access the nonlinear text arc editor list.
This will provide a list with each individual tickmark or text entry, where you can reposition or adjust its other settings, including each item’s visibility. Tickmarks imported from a CSV file always come in as lines, so the tick shape of each one is set on the list, with the Set All: buttons setting one shape onto all of them at once.
Copy to Nonlinear
Section titled “Copy to Nonlinear”
Sometimes a gauge may contain arcs that are mostly linear in design, but that due to some specific requirements would need to be handled as nonlinear.
In some of those cases it may be possible to initially design the arc as linear, and then use the Copy to Nonlinear button to complete the editing in nonlinear mode. Tickmarks keep their tick shapes on the copy, and any numerical scales copy their values as editable text items, including Roman numerals.
Tick Shapes
Section titled “Tick Shapes”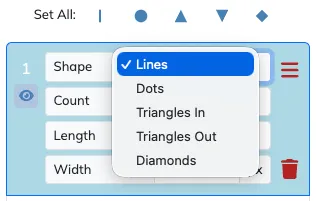
Tickmarks are not limited to lines. Every subsegment of a tickmarks scale, linear or nonlinear, can have its own shape, chosen with the Shape selector on its row of the Scale Format list:
- Lines, the classic tick.
- Dots, a circle whose diameter is its Length.
- Triangles In, with the tip pointing to the gauge center.
- Triangles Out, with the tip pointing outward, the bezel and tachymeter convention.
- Diamonds.
New subsegments start as Lines, and a subsegment added while another is selected copies that one’s shape.
The row’s size fields are specific to each shape type. Length always applies, as the radial size of the shape as a fraction of the arc width. Width, in the current measurement unit, shows only for Lines. Width Ratio shows only for triangles and diamonds and sets the shape’s tangential width as a ratio of its radial size, from 0.05 to 2, so 1 is as wide as it is tall. Dots have no width field.
The Copy to Nonlinear button carries each subsegment’s shape and its details across to the nonlinear scale, and the layer’s Width Scale and Alignment settings apply to every shape.
Set All
Section titled “Set All”The list header has a row of Set All: buttons, one per shape, where each sets that shape onto every subsegment of the scale at once, for quick changes. Handy as well after importing a nonlinear CSV file, whose tickmarks always come in as Lines.
Hiding Subsegments
Section titled “Hiding Subsegments”The Scale Format list items, linear and nonlinear, have a visibility toggle, the eye button under the row number. A hidden subsegment is not drawn on the canvas or in prints and exports, but it keeps its slot, its guides and its snapping, so it can be switched back on without disturbing the scale. Hidden subsegments show in a light grey in the scale preview.
While editing the list, the selected subsegment’s tickmarks are highlighted in red on the canvas, or in a lighter red when that subsegment is hidden, so it can still be seen. The highlight is an editing aid only and never appears in prints or exports.
The Edit Nonlinear Text list of a nonlinear Text Arc layer has the same visibility toggle for its text items.